Assignment 11
by
Allison McNeece
For this assignment we will be investigating the rose (or rhodenea) curve as a way of exploring graphs plotted with polar coordinates.
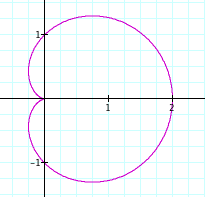
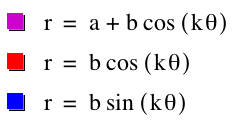
We will start by graphing the equation r =a + b*cos(kθ)
a =1, b =1, k =1
|
a =1, b =1, k =2
|
a =1, b =1, k =3
|
a =1, b =1, k =4
|
Hmmm... the name for this graph is starting to make sense. As the integer value for k changes "petals" form in our graph.
Below is an animation that allows k to vary from 0 to 20.
(With any of the animations you should be able to click or double click on the animation to pause or start the animation. Also if you have a scroll function on your mouse you can scroll through each frame while the animation is paused)
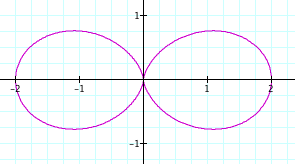
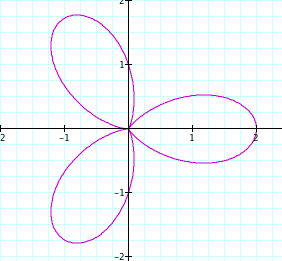
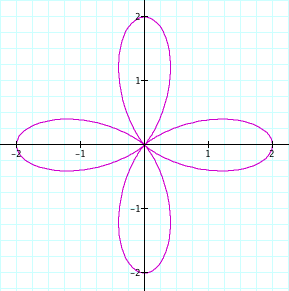
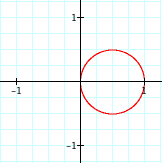
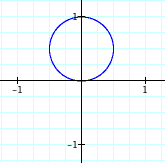
What if we took a out of the equation and use r = b*cos(kθ)?
b =1, k =1
|
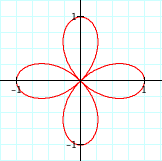
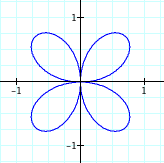
b =1, k =2
|
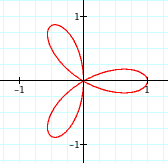
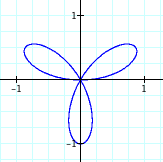
b =1, k =3
|
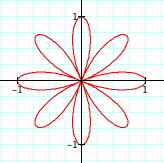
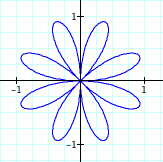
b =1, k =4
|
Notice how in our first equation which included a the number of petals was k but when we took a out of the equation the number of petals is now 2k for even k.
Again let's look at an animation letting k vary from 0 to 20 we get:
Let's get real crazy and replace cosine with sine, giving us the equation r = b*sin(kθ)
b =1, k =1
|
b =1, k =2
|
b =1, k =3
|
b =1, k =4
|
And an animation letting k vary from 0 to 20:
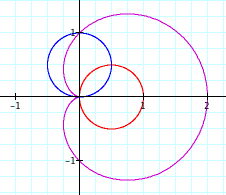
Let's put them all together to compare:
a graph of the case where a=1, b=1, k=1
|